Popular Dashboards
Our Popular Dashboards , articles and updates

Our Popular Dashboards , articles and updates
 (1)_page-0001.jpg)
This dashboard provides a state-wise distribution of universities, where you can see the number of institutions in each state. You can compare university types across different states using charts ..... See More
_page-0001.jpg)
This NREGA dashboard allow you to explore data for each state and district in India. You can select your desired location to view key metrics like the no. of workers, budget and expenditures on wages and materials ..... See More

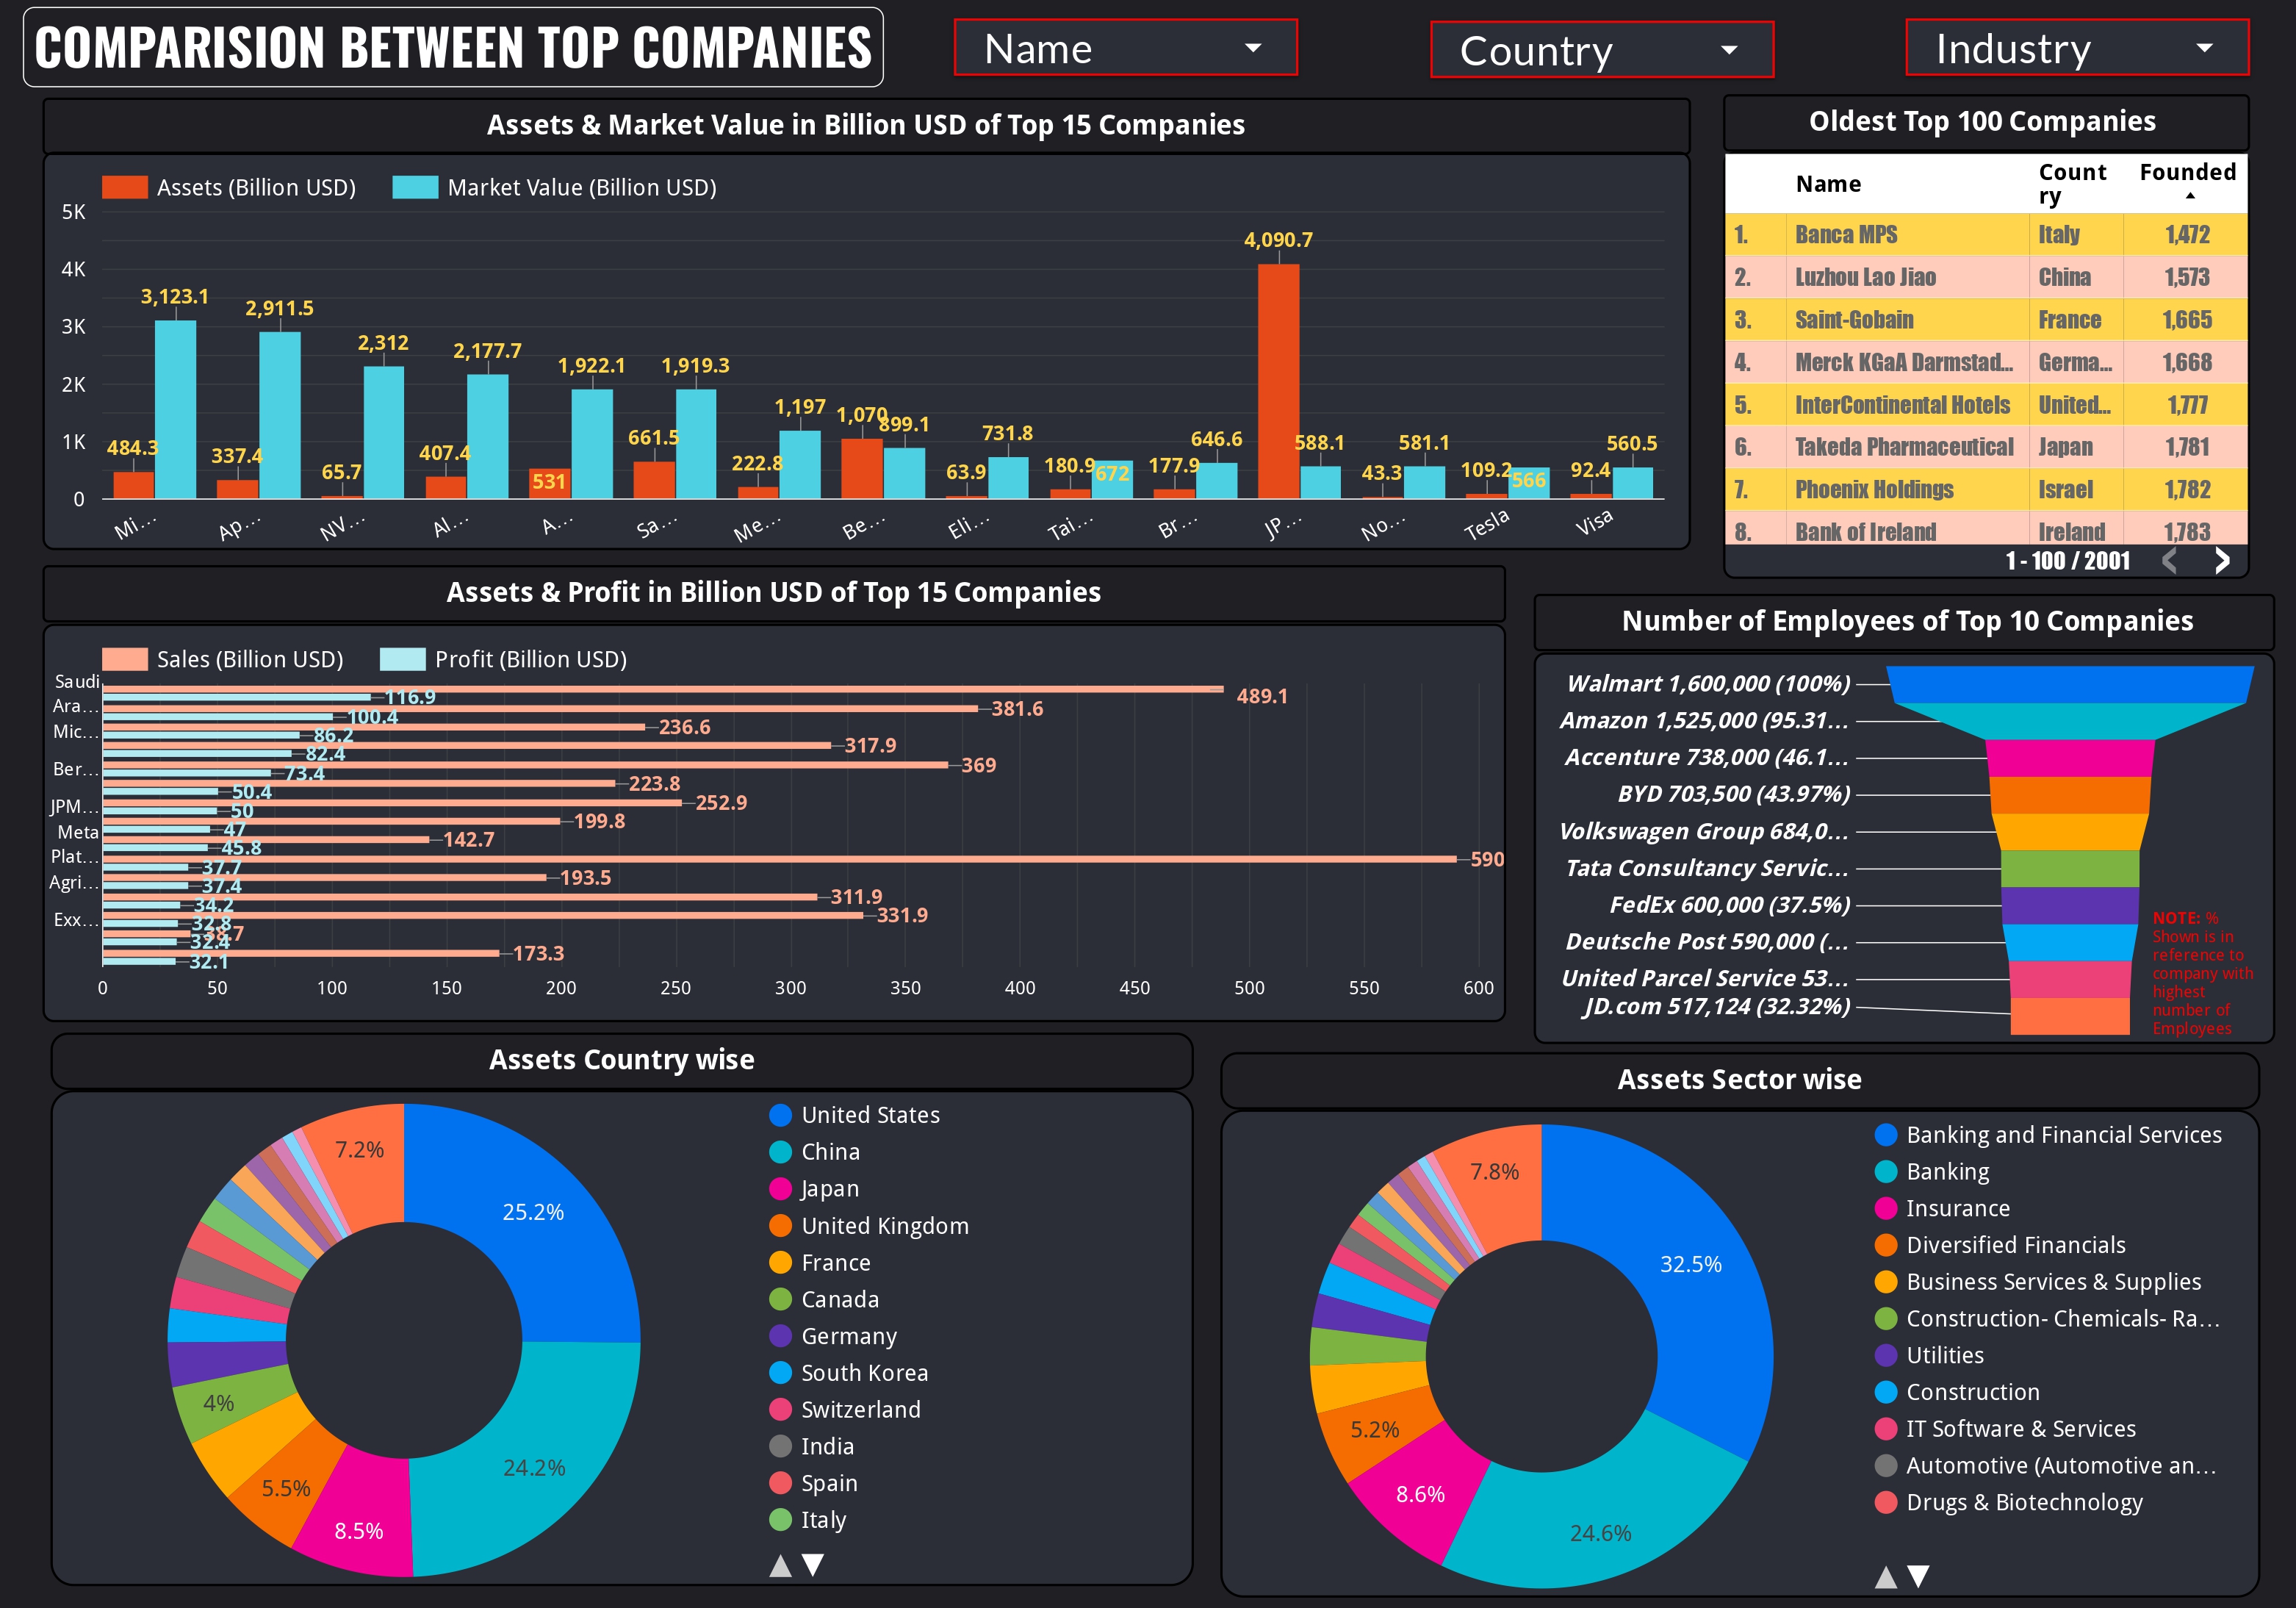
This dashboard provides an in-depth comparison of the top global companies, featuring key financial metrics, workforce data etc. this Dashboard highlight assets, market value, sales, and profit for the leading companies ..... See More
_page-0001.jpg)
This Dashboard provides a detailed breakdown of the UP Legislative Assembly election results , tracking the number of seats won by various parties over the years .A slider allows filtering results by election years...... See More
_page-0001.jpg)
This dashboard visualizes Middle East crude oil production, allowing users to filter by country. It features a heatmap, geographic map, and a card summarizing daily production in barrels. You can filter the data by country....... See More
_page-0001.jpg)
The dashboard compares planetary characteristics like diameter, day length, temperature, orbital period, and number of moons. A slicer allows users to filter by planet for focused exploration of individual data. See More